{{selectedAlertBand.alertDescription}}
{{selectedAlertBand.incident.heading}}
Message last updated - Thursday 02nd May 2024
{{selectedAlertBand.incident.heading}}
Message last updated - Thursday 02nd May 2024
Message last updated - Thursday 02nd May 2024
{{selectedAlertBand.alertLinkText}} {{selectedAlertBand.alertLinkText}}
For further updates subscribe
As part of our Get River Positive commitment, we've pledged to be as transparent as possible with the data we collect about our water recycling network and the improvements that we're making, especially around storm overflows.
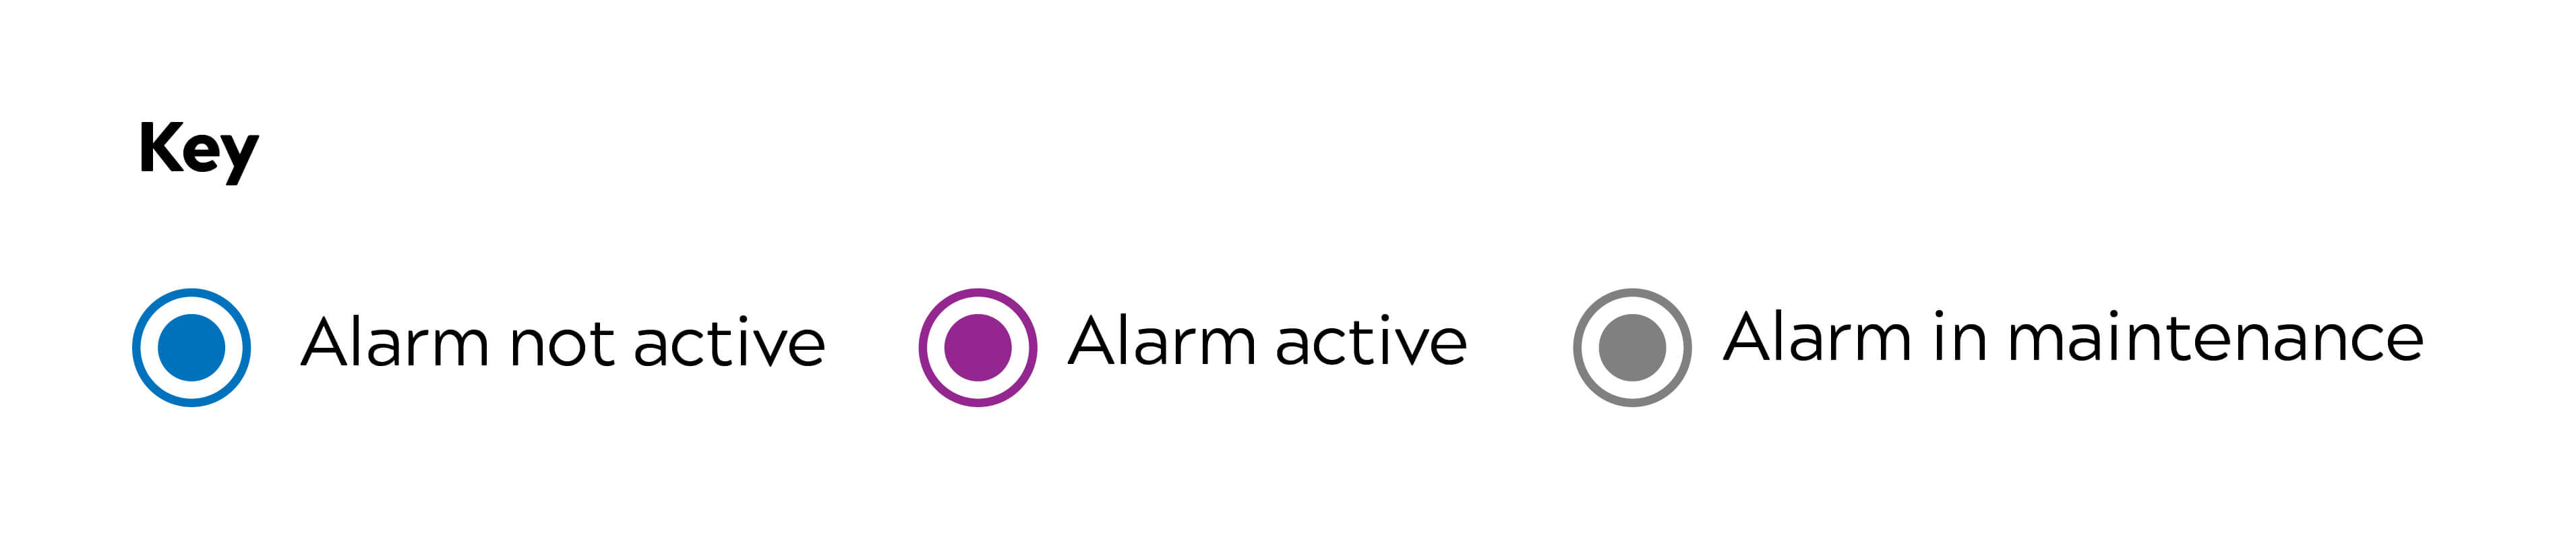
The map below shows where our storm overflow monitors are located and provides near real time information on storm overflow activations. Using data from our event duration monitors, this map is updated every 60 minutes and gives an indication of the latest activation date, time and duration.
You can use the search function at the top to find addresses or zoom in on the map to bring up the locations of the overflows. When you pan around on the map itself, click on the coloured icons to see the information about them.
Find out more about our EDM return data and investment in storm overflows and our other Get River Positive commitments.
Data to the this map started on the 5th April 2024, some monitors will show N/A in their history as they have not been active since the 5th April and have not logged any data, history for each monitor will be shown after the next activation. The full data for each sensor can be found on storm overflow information page.